Extracting Financial Data from SEC 10-K Filings with LLMs
Finding structure in SEC filings
Every year, U.S. public companies file a comprehensive financial report called a 10-K. These reports are filed in HTML format, which can complicate automated parsing. Traditional approaches to extracting data from these HTML tables are challenging, time-consuming, and often imprecise. What should be a straightforward data extraction task becomes an endless game of whack-a-mole with edge cases.
Enter LLMs using structured generation.
This blog post demonstrates how we can use structured text generation to cut through the chaos and extract clean, consistent data directly from 10-K reports. We'll show you how to transform messy HTML tables into neat CSVs (easily read by Excel) that are primed for analysis.
Existing solutions
Several common approaches to parsing 10-K filings exist, but each has its limitations:
- Manual Extraction: Time-consuming and prone to errors.
- Custom Parsing Tools: Require frequent updates as companies alter their reporting formats.
- SEC's XBRL Format: Though machine-readable, the use of custom tags by companies hinders effective cross-company comparison.
Unfortunately, none of these methods provide a comprehensive solution to the challenge.
A solution: structured generation
Fortunately, we can use structured generation to extract the information we need from the 10-K directly into tabular data. Feed some ugly text into our model, get a fresh CSV on the other side.
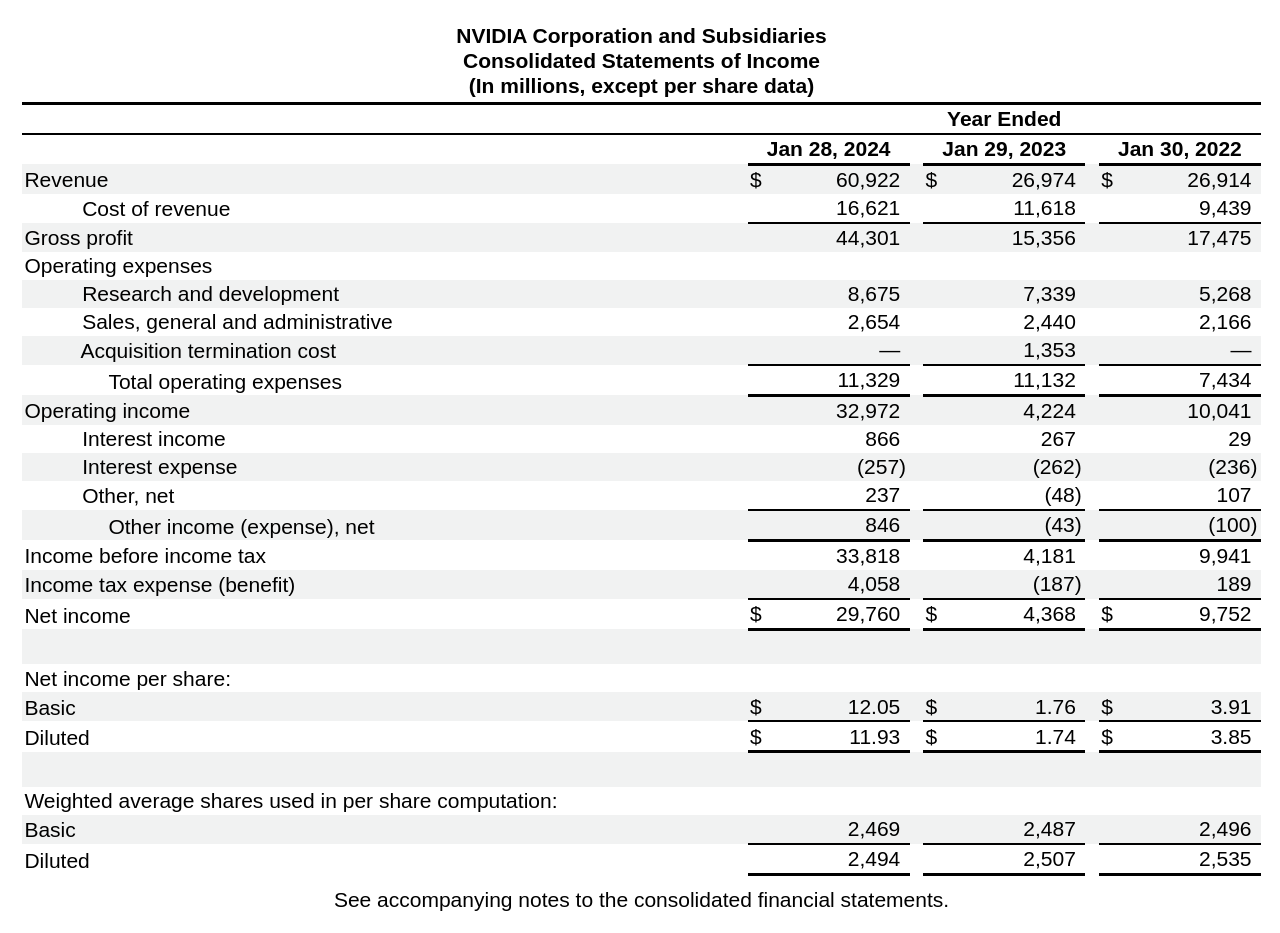
Put simply, we're going to go from this unpleasant mess:

Figure 1: NVIDIA's income statement
to this clean, tidy CSV:
   year  revenue  operating_income  net_income
0  2024    60922             32972       29760
1  2023    26974              4224        4368
2  2022    26914             10041        9752
Our goal: extracting key financial metrics
Let's focus on three essential numbers from a company's income statement: revenue, operating income, and net income.
Some definitions for you:
- Revenue: The total amount of money earned by a company from its primary business activities, typically from selling goods or services.
- Operating Income: The profit earned from a company's core business operations, calculated by subtracting operating expenses from revenue.
- Net Income: The company's total profit after all expenses, taxes, and other costs have been deducted from revenue.
Let's take a look at what these three metrics look like in earnings reports.
What the reports look like
Here are two examples of income statements.
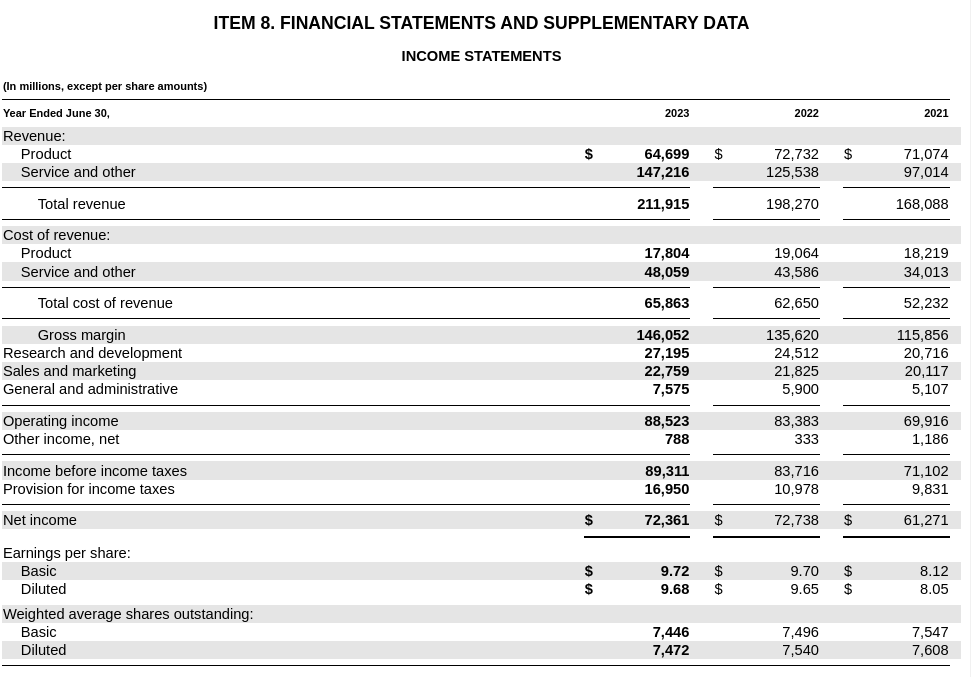
The first is Microsoft. We can see revenue at the top, operating income in the middle, net income on the bottom, and three columns representing each reporting year.

Figure 2: Microsoft's income statement
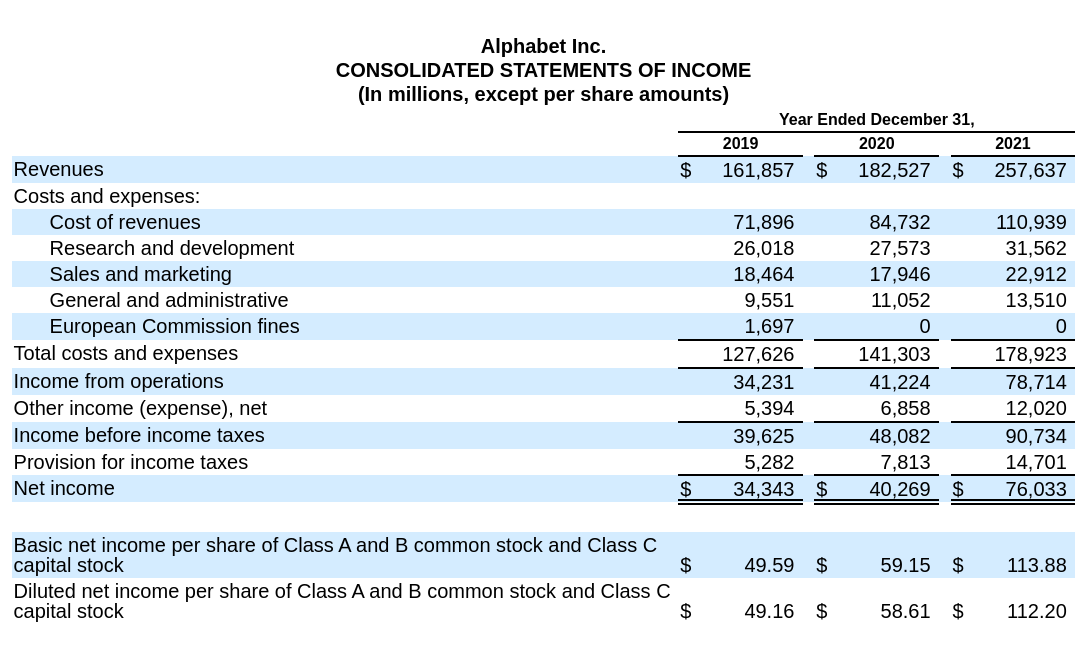
Let's compare that to Alphabet's income statement.

Figure 3: Alphabet's income statement
Note a few significant issues that complicate simple parsing strategies:
- Inconsistent naming (”Total Revenue” vs. "Revenues")
- Order and field formatting is completely different
- Year column ordering varies
The takeaway: these are not the same documents, but they communicate the same meaning.
Thankfully, language models are great at understanding meaning without being too caught up in details like row formatting or differences in naming conventions.
The four steps to extract earnings information
We need to do four things to work with 10-K reports.
- Clean up the HTML 10-K into a simpler format
- Find the income statement
- Defining the shape of the model's output
- Extract the data we want from the income statement
Preprocessing the text
The 10-K native format of HTML contains considerable markup that doesn't add too much information while simultaneously eating up valuable context.
We can pass the HTML directly into our model, but this is costly, slow, and inefficient.
We do not like inefficiency at .txt.
When we work with language models, we want text that contains the most information with the fewest tokens. Markdown is a great example of an efficient format. HTML can be easily converted to markdown using a package like markdownify.
Take a look at data we've converted:
FORM 10-K

ANNUAL REPORT PURSUANT TO SECTION 13 OR 15(d) OF THE SECURITIES EXCHANGE ACT OF 1934

    For the fiscal year ended January 28, 2024

OR

TRANSITION REPORT PURSUANT TO SECTION 13 OR 15(d) OF THE SECURITIES EXCHANGE ACT OF 1934

Commission file number: 0-23985

NVIDIA CORPORATION

(Exact name of registrant as specified in its charter)

Delaware
Here's the original HTML:
<div style="text-align:center"> <span style="color:#000000;font-family:'NVIDIA Sans',sans-serif;font-size:13pt;font-weight:700;line-height:120%"> FORM <ix:nonnumeric contextref="c-1" name="dei:DocumentType" id="f-1">10-K</ix:nonnumeric> </span> </div> <div style="text-align:center"> <table style="border-collapse:collapse;display:inline-table;margin-bottom:5pt;vertical-align:text-bottom;width:93.750%"> <tbody> <tr> <td style="width:1.0%"></td> <td style="width:2.650%"></td> <td style="width:0.1%"></td> <td style="width:1.0%"></td> <td style="width:95.150%"></td> <!-- HTML continues -->
Much better.
Finding the income statement
The markdown version of our HTML file is still a large document, in excess of 120k tokens. We could pass the entire document into a language model like Phi 3.5, but filling the entire window is slow and requires significant hardware. Further, providing too much information to your model can often confuse it.
Income statements in the 10-K may span multiple pages, occur in different locations across reports, or generally be difficult to find in an automated way.
What we're going to do is classify each page as being "about" the income statement. Pages that have been classified as income statement-related will be used for extraction purposes, and we discard all other pages.
With Outlines, this classifier is trivial:
import outlines

# Load our model
model = outlines.models.transformers("microsoft/Phi-3.5-mini-instruct")

# Classification function
yesno = outlines.generate.choice(model, ['Yes', 'Maybe', 'No'])

# Requesting a classification from the model
result = yesno(
    "Is the following document about an income statement? Document: {...}"
)

# Do something if it's a "Yes"
if result == 'Yes':
    ...
Our demo provides more sophisticated classification prompts, as well as how to iterate through all the pages of the 10-K.
After the classification step, we'll usually have a chunk of the 10-K that contains the income statement in markdown format:
| | | | | | | | | | | | | | | | | | | |--------------------------------------------------------|---|---|--------------|--------|---|---|---|---|--------------|--------|---|---|---|---|--------------|--------|---| | | | | Year Ended | | | | | | | | | | | | | | | | | | | Jan 28, 2024 | | | | | | Jan 29, 2023 | | | | | | Jan 30, 2022 | | | | Revenue | | | $ | 60,922 | | | | | $ | 26,974 | | | | | $ | 26,914 | | | Cost of revenue | | | 16,621 | | | | | | 11,618 | | | | | | 9,439 | | | | Gross profit | | | 44,301 | | | | | | 15,356 | | | | | | 17,475 | | | | Operating expenses | | | | | | | | | | | | | | | | | | | Research and development | | | 8,675 | | | | | | 7,339 | | | | | | 5,268 | | | | Sales, general and administrative | | | 2,654 | | | | | | 2,440 | | | | | | 2,166 | | | | Acquisition termination cost | | | | | | | | | 1,353 | | | | | | | | | | Total operating expenses | | | 11,329 | | | | | | 11,132 | | | | | | 7,434 | | | | Operating income | | | 32,972 | | | | | | 4,224 | | | | | | 10,041 | | | | Interest income | | | 866 | | | | | | 267 | | | | | | 29 | | | | Interest expense | | | (257) | | | | | | (262) | | | | | | (236) | | | | Other, net | | | 237 | | | | | | (48) | | | | | | 107 | | | | Other income (expense), net | | | 846 | | | | | | (43) | | | | | | (100) | | | | Income before income tax | | | 33,818 | | | | | | 4,181 | | | | | | 9,941 | | | | Income tax expense (benefit) | | | 4,058 | | | | | | (187) | | | | | | 189 | | | | Net income | | | $ | 29,760 | | | | | $ | 4,368 | | | | | $ | 9,752 | | | | | | | | | | | | | | | | | | | | | | Net income per share: | | | | | | | | | | | | | | | | | | | Basic | | | $ | 12\.05 | | | | | $ | 1.76 | | | | | $ | 3.91 | | | Diluted | | | $ | 11\.93 | | | | | $ | 1.74 | | | | | $ | 3.85 | | | | | | | | | | | | | | | | | | | | | | Weighted average shares used in per share computation: | | | | | | | | | | | | | | | | | | | Basic | | | 2,469 | | | | | | 2,487 | | | | | | 2,496 | | | | Diluted | | | 2,494 | | | | | | 2,507 | | | | | | 2,535 | | |
The markdown table is easy enough for us to read, but it still has the same machine readability issues as before:
- Inconsistent names + line item locations
- Varying line item order
- Extraneous information and formatting
These challenges make it difficult for traditional rule-based systems to accurately and consistently extract the financial data we need.
This is where we can use structured generation to extract the numbers we want directly into a CSV.
Telling our model exactly what we want
Remember those Excel spreadsheets you've worked with? That's essentially what we're trying to create here – a neat table where each row represents a year of financial data, with columns for the values we want to extract.
We want our final output to look like this:
year    revenue    operating_income    net_income
2024    60922     32972              29760
2023    26974     4224               4368
2022    26914     10041              9752
Outlines allows you to specify a "structure" for your language model's output using regular expressions. In our case, this means writing a linear expression that describes the type of each column in the CSV.
Think of it like creating a template:
- Year should always be four digits (like 2024, not just 24)
- Numbers should be whole (no decimals)
- Every value needs to be separated by commas
- Numbers can be positive or negative
- No dollar signs or other special characters allowed
Using structured generation, we can enforce these rules using something called a "regular expression" – essentially a template that our model must follow. The regular expression looks pretty scary:
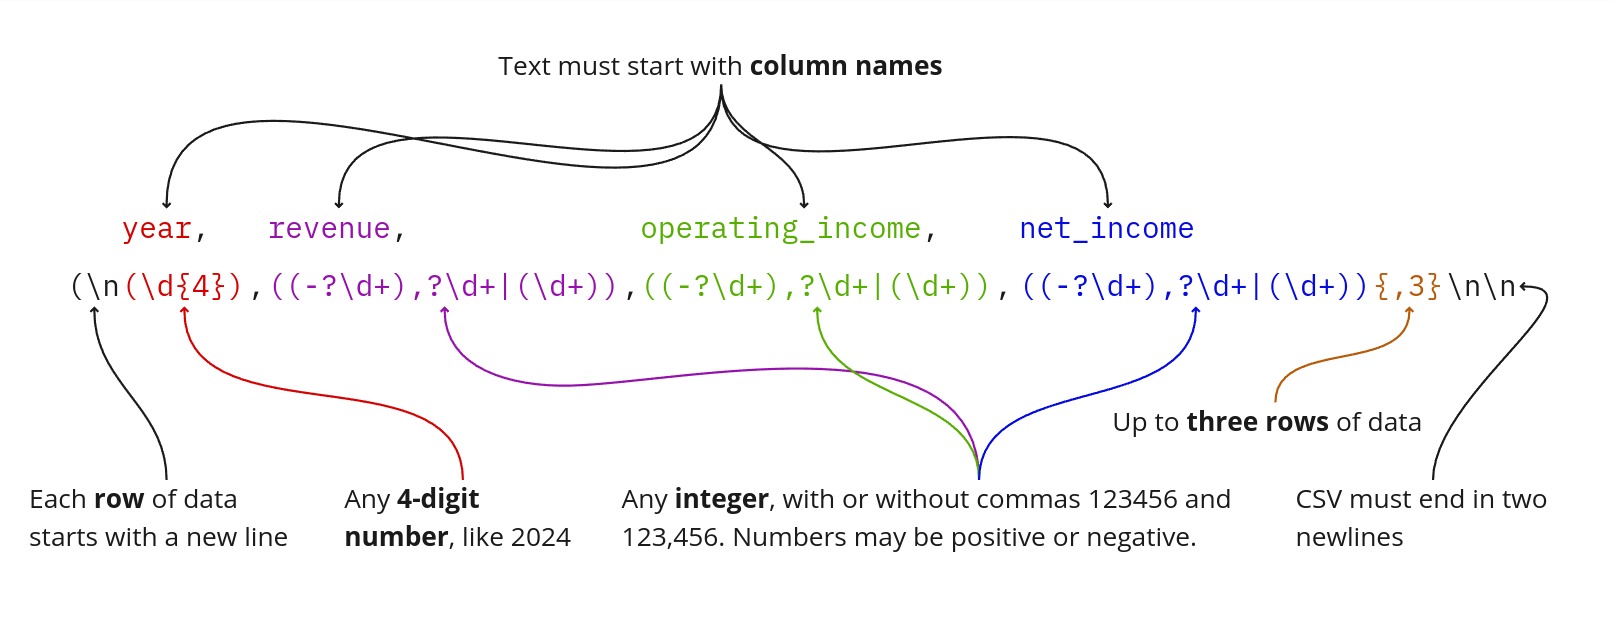
year,revenue,operating_income,net_income(\n(\\d{4}),((-?\\d+),?\\d+|(\\d+)),((-?\\d+),?\\d+|(\\d+)),((-?\\d+),?\\d+|(\\d+))){,3}\n\n
Raw regular expressions can be difficult to read, so here's a quick diagram to illustrate what each piece of it means:

Figure 4: CSV regular expression diagram
Don't worry too much about understanding the regular expression if you're not familiar with them. We've included a helper function in the demo that makes creating these patterns much easier. The important thing is that this pattern acts like a strict template, ensuring our model always produces clean, consistent data that's ready for analysis.
Structured generation with Outlines will produce output that is only consistent with this format. It cannot fail to include a comma, add a two-digit year suffix like 24 instead of 2024, etc. Any structured output produced using this regular expression will always be parsable by standard tabular data tools like pandas, Excel, databases, etc.
Extracting our data
Now comes the fun part – extracting the data we want with our LLM. Let's walk through how we turn that messy financial statement into clean, usable numbers.
Equipped with our income statement and the expected output format, we can build an "extractor" function. This function will accept a prompt containing the income statement and some processing instructions, and return text in the format we specified.
# Make an extractor function
csv_extractor = outlines.generate.regex(
    model,
    csv_regex,
    sampler=outlines.samplers.greedy()
)
With our extractor ready, we can feed it the income statement. Calling csv_extractor asks our LLM to generate new tokens:
# Extract our table
csv_data = csv_extractor(
    extract_financial_data_prompt(
        columns_to_extract,
        income_statement
      )
)
We'll omit the full prompt for brevity, but it can be found here.
And just like that, we get our clean, structured data for NVIDIA:
year,revenue,operating_income,net_income
2024,60922,32972,29760
2023,26974,4224,4368
2022,26914,10041,9752
If you are an individual used to working with tabular data tools like pandas, you can convert this into a standard, programmable data frame with
from io import StringIO
import pandas as pd

# Load into a dataframe
df = pd.read_csv(StringIO(csv_data))
Which gives you a nice, organized table:
   year  revenue  operating_income  net_income
2  2022    26914             10041        9752
1  2023    26974              4224        4368
0  2024    60922             32972       29760
That's it! See how simple it was to convert these horrible HTML documents to a simple CSV?
Verifying our results
While the structured generation extraction approach is powerful, it can have your standard language model issues.
Before using the approach, try to follow some best practices:
- Test Thoroughly: We've tested this approach with reports from Microsoft, NVIDIA, and Alphabet, comparing the results against manually extracted data. You can find these tests in our repository.
- Know the Limitations: Getting reliable results requires careful prompt engineering and data cleaning. LLMs can invent information.
- Stay Updated: SEC filing formats and structures may change over time. Regularly review and update your extraction methods to ensure they remain effective and accurate.
Conclusion
We've explored how structured generation can be used to extract financial data from SEC filings, specifically focusing on income statements from 10-K reports. Structured generation can transform chaotic HTML tables into clean, analysis-ready data.
However, the implications of this approach extend far beyond earnings reports.
- Extracting specific data from scientific papers
- Converting legal documents to structured contract terms
- Cleaning product catalogs for E-commerce sites
- Standardizing patient data using medical records
However, it's crucial to remember that while this method is powerful, it's not infallible. As with any AI-driven process, the results should be verified and validated, especially when dealing with critical data.
With structured generation, we're not just parsing documents - we're unlocking the potential of human-readable data at machine scale.
Getting started
Want to try this yourself? Check out full demonstration repo to play with all the detailed code, or see our cookbook for a simple example.